nthorpe
Raised, and subsequently abandoned, by wolves, I went on to an illustrious career, where I selected the wallpaper for the little known small hadron collider, located outside Warambool.
Tracking Cycle Time, lo-fi
Posted in Aconex Extensions Team on June 4, 2011
Cycle time is the time that elapsed from the beginning to the end of a process. In lean practice, this metric takes the place of velocity as a way of understanding how fast we’re moving.
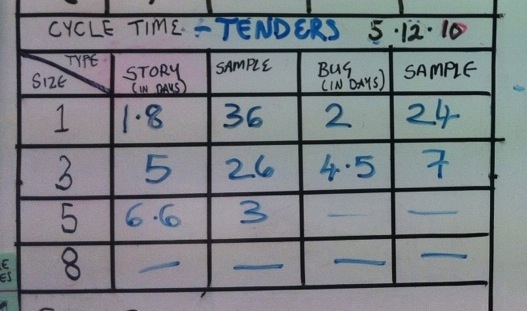
This team are tracking cycle time from the moment a card comes into play until it is done. The grid shows the average time for a story to transit the board, by type and size of card, and the size of sample. So, for example, a 3 point story takes this team an average of 5 days to complete, with bugs taking slightly less: 4.5 days. This figure is an average over 26 cards.
Teams often use old-school office date stamps to stamp today’s date on a card when they pick it up to work on, and again when it’s done. Later on, someone can simply subtract one date from the other. Alternatively, if the team is working in iterations, team members can simply write the day number of the iteration on the card.
Here is a slightly more hi-fi version:

Spotted: Aconex Extensions Team
Board Movies
Posted in Lonely Planet SPP Dev Team on May 28, 2011
Dan says: “Just for interest – I thought it would be interesting to see whether any notable patterns came out of it.” – Dan Heath
Sometimes at retro it’s hard to remember everything that went on during the iteration. And sometimes you don’t spot problems at the time they are actually happening. There’s just too much going on.
The brilliant Dan Heath set up a camera with a script which took a photo every 5 minutes and stitched them together as a movie. The team can watch the iteration at retro and can see the cards moving (or not moving) on the wall. Where did they become blocked? Anyone remember why? Who took the last bit of cake?
Dan’s script stitches the images together into a month by month archive of activity on the board, and it only captures images during working hours, so you don’t get hours of spooky darkness.
He was happy to share his scripts. Here are the crontab entries, other scripts are available by email (although Dan warns they were done as a really quick hack job – “the nastiest hack I’ve written since uni”):
# ************* Crontab ***************
# m h dom mon dow command
*/5 8-18 * * mon-fri export DISPLAY=:0 && /home/robh/boardcam/vlc-cmdline/run.sh
1 19 * * mon-fri /home/robh/boardcam/vlc-cmdline/run_daily.sh
Spotted: LPOS development team
Countdown to a Milestone
Posted in Lonely Planet SPP Dev Team on May 3, 2011

The LPOS Team track progress toward a big milestone.
Team says: “The days are decreasing at exactly one per day, but the feature cards definitely aren’t!”
We’ve seen agile burn-down charts many times. But here’s a different approach. This team runs a lean/kanban board, and they don’t estimate in points, so they decided not to use the traditional burn-down chart. Sometimes, there are immovable deadlines and in this case an author was going on the road to research a destination. Tickets were booked long ago and there was no possibility of delaying the release.
As the release date approached the team simply kept track of the number of feature cards versus the number of days left. This was a nice simple metric which stared them in the face every day, and gave urgency to the task of ruthlessly cutting scope to meet the date. The days always decrease of course, but the card count can increase as additional stories are uncovered. Sometimes product owners can be reluctant to cut scope, but this made it painfully obvious that it was necessary in order to meet the release date. When the number of remaining cards fell below the number of remaining days the back of the beast was finally broken.
Spotted: LPOS Team