Posts Tagged Cycle Time
Lego Board
Posted by fe in If we tell you we'll have to kill you on August 28, 2015
This lego board serves a particular need by a team in a unique way – like all the best board hacks do.
This wall is used by a procurement team for a large organisation as a place for conversations about the status of various procurement projects. As well as the usual conversations around current status, blockers, progress, the team wanted to have visual indicators that would prompt them to have conversations about how long a project had been running, what stages of procurement it had already been through, etc.

Prototyping to learn
The team started by quickly building a prototype wall using index cards with mail-merge stickers on them describing each procurement project. This information had previously lived in a spreadsheet. With the work quickly thrown up onto a wall, they asked themselves the question: “What is this wall not telling me?”.
Answer: a lot! There were so many cards it was hard to see what was going on. They were hard to read. And the wall couldn’t tell the team anything about cycle time: how long was each project taking to go through the whole procurement process?
Additionally, one of the team members had a visual disability, so the team wanted something with high contrast and large lettering. This was going to be hard to achieve with cards, given the number of procurement projects which were in flight at any time.
With this learning, the team built a second board, this time from Lego.
The board now
The left hand side of the wall is fairly familiar – a line for each project, with columns for portfolio (coded by colour), category and status, as well as the cost of the project. It’s over on the right that the fun begins. The grey lego base board is divided horizontally into sections for each team member – who is limited to no more than 7 projects on the go and has their own little lego avatar and a “one brick” row 2 lugs high for each project. Vertically, the board is divided into weeks.

Team members get their own minifigs and each is limited to 7 lines and therefore 7 projects.
Each project is tracked using a lego brick. The size of brick indicates expected length of delivery of the project and the colour indicates the procurement stage that the project is currently in.

Brick colour represents process steps. Brick size represents T-shirt – size estimates.
At the beginning of each stage of procurement, a project’s lego brick starts in week 1 and progresses on from there. At the end of each stage, the number of weeks spent is recorded on the edge of the brick using a sharpie, the appropriate colour brick for the next stage of the procurement process is stacked on top of the previous, and the stack of bricks goes back to week 1.
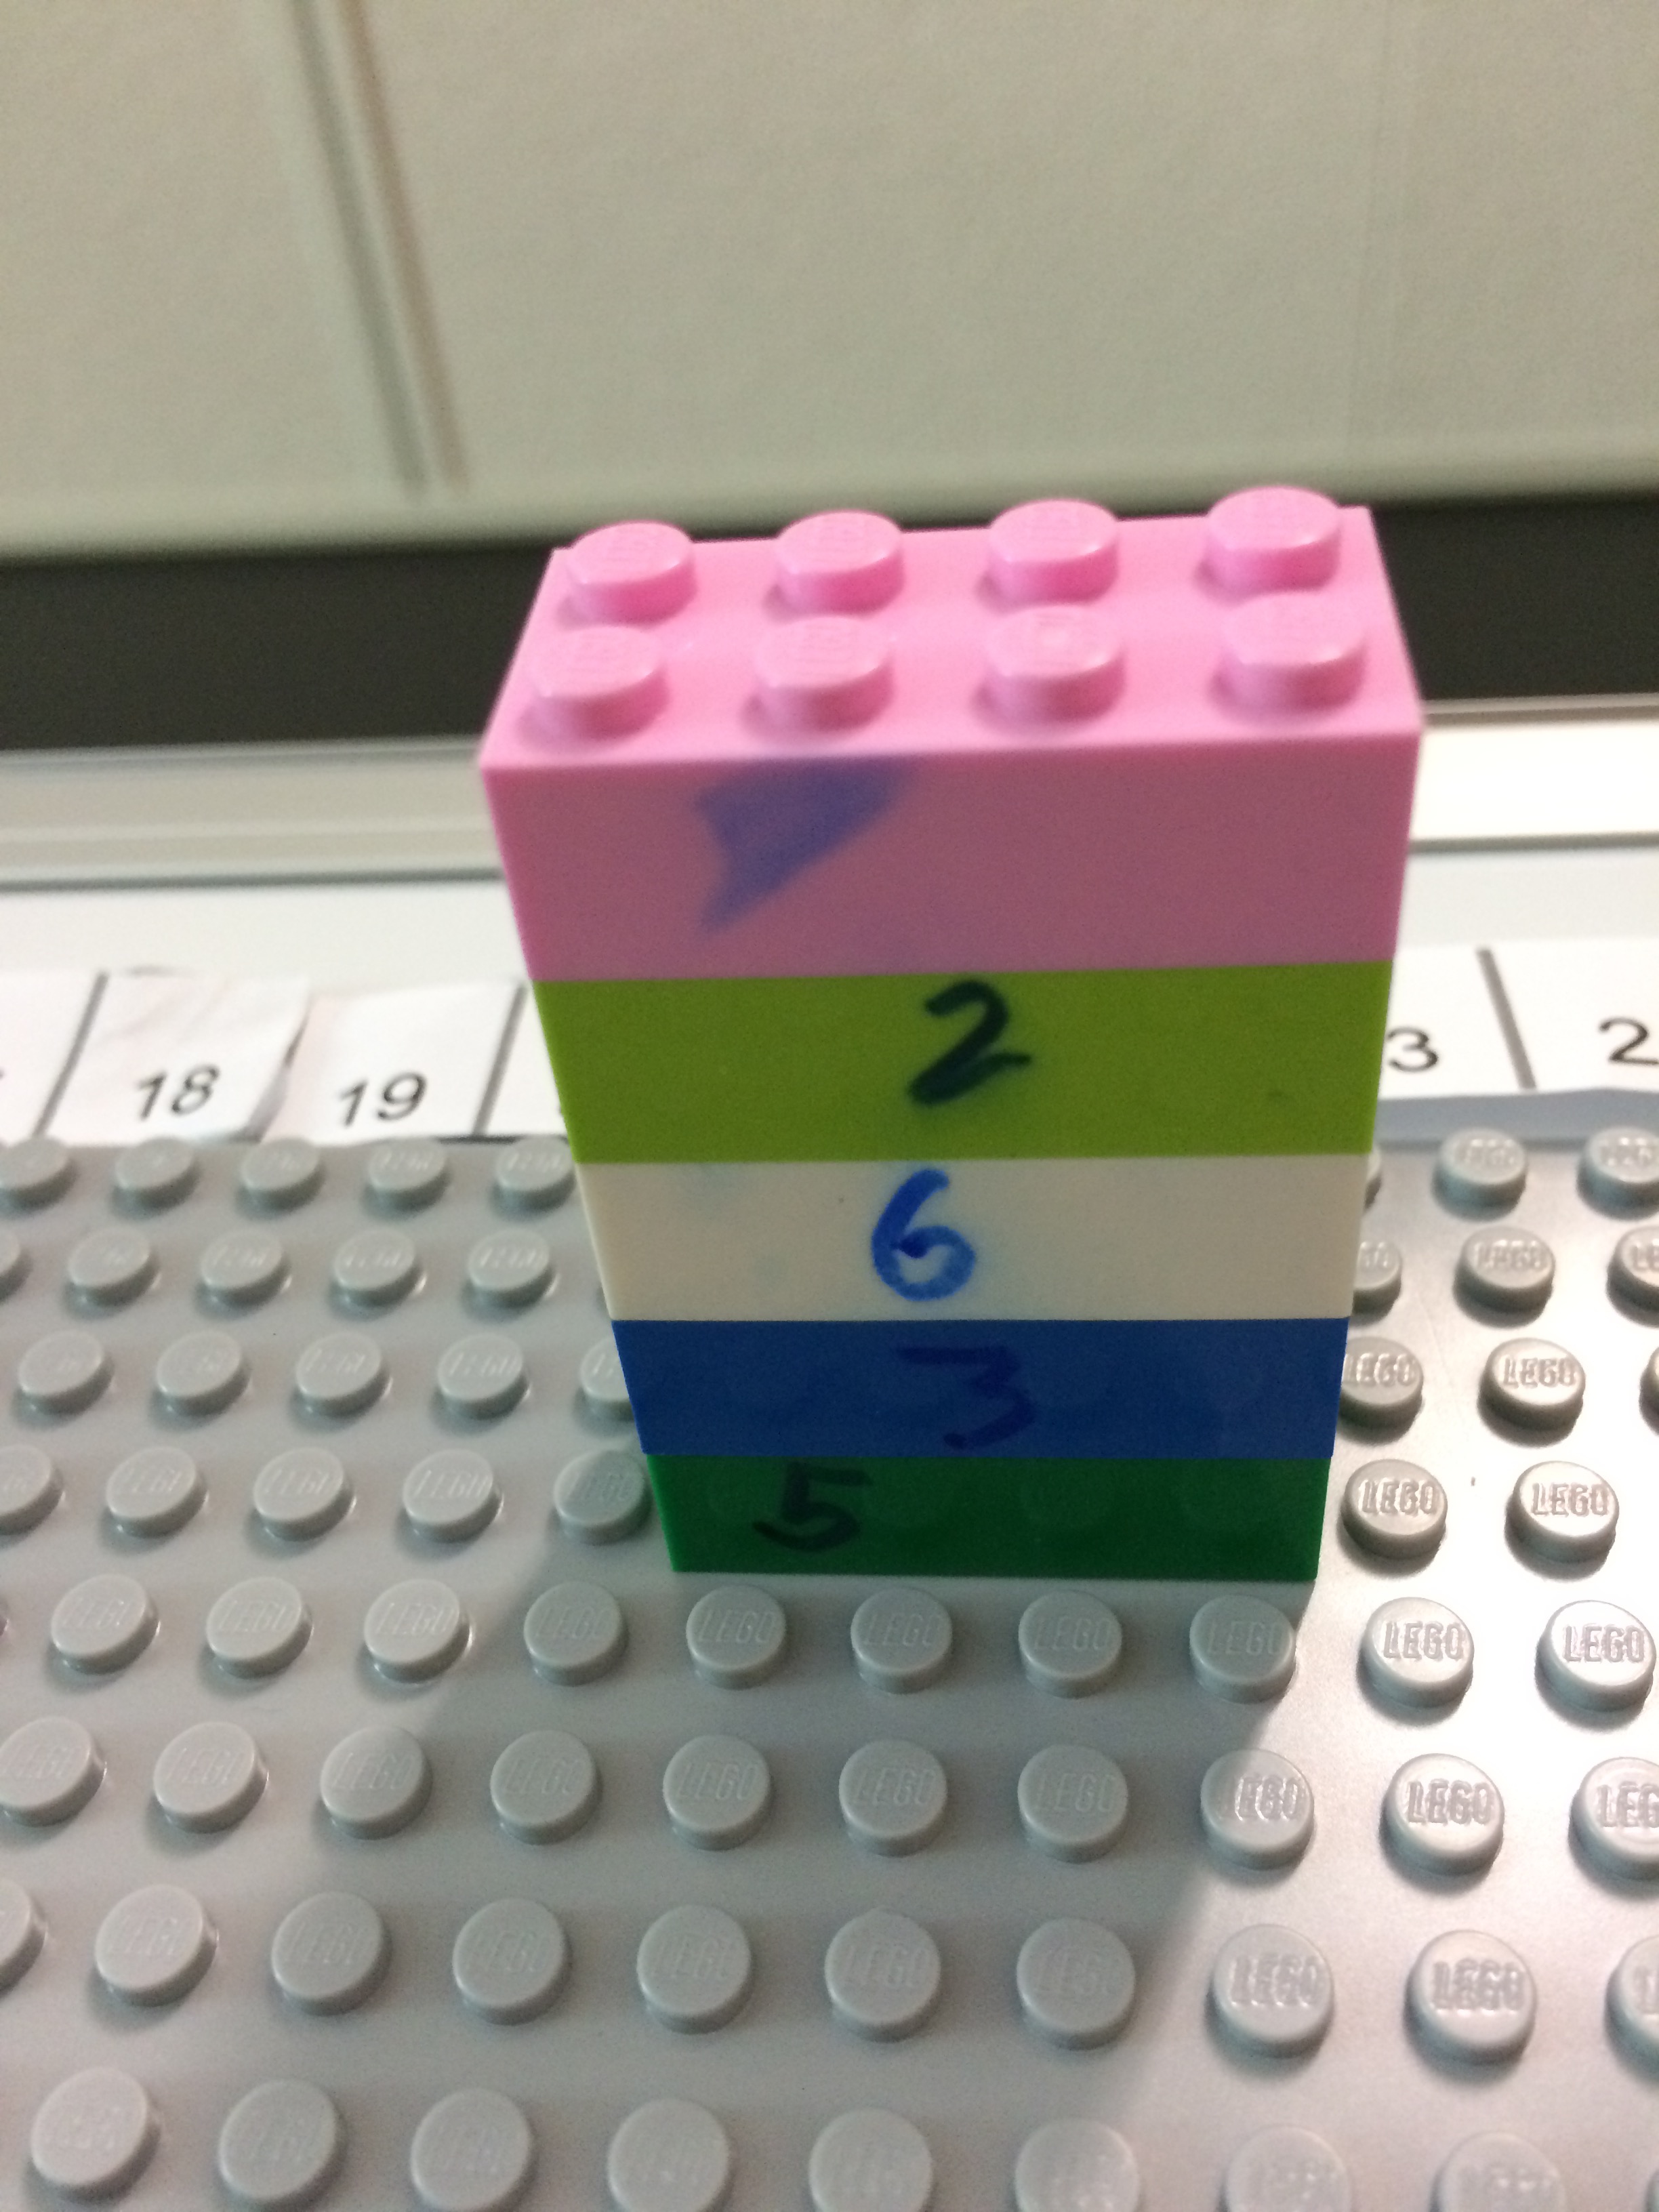
Each lego layer shows cycle time for a stage of the procurement process in weeks, together making up the whole project.

Team members can read weeks of cycle time for each project off the scale at the top.
So it’s easy to see:
- how long a project has been in it’s current stage according to the week column it is in;
- the stages it has already been through by the different coloured bricks in it’s stack – not every project uses all steps, so it’s easy to see, for example, when a project hasn’t gone out for RFP as there will be no white brick in it’s stack);
- which stage any given job is at by the top coloured brick;
- whether it has been longer than planned in a stage – for example a medium-sized brick shouldn’t be sitting out at week 14; and
- how long in total it’s been on the go by quickly adding the numbers on the sides of the bricks.

Follow the dots: the simplest way to track cycle time
Posted by nthorpe in Telstra Contact Solutions CCRI Team on April 4, 2013
This team wanted to track cycle time, and chose to do this by simply putting a dot on each card every day at standup. This way, you can count the dots on each card in the “done” pile at the end of the iteration (or any time), and understand average cycle time per card, or by point-size.
Cycle time for the story below is 6 days.
But this team took it a step further, colour-coding the dots by number of days in each process step. So, the card below spent 2 days in the backlog (green dots), then 3 days in build (red), and 2 days in test (black).
“Some of the cards had dots going all around the edge of the card!” says Gina. And sometimes the stories bounced back and forth between build and test (you would see this as alternating runs of red and black). Great fodder for retro.

Spotted: Telstra Contact Solutions, CCRI
Tracking Cycle Time, lo-fi
Posted by nthorpe in Aconex Extensions Team on June 4, 2011
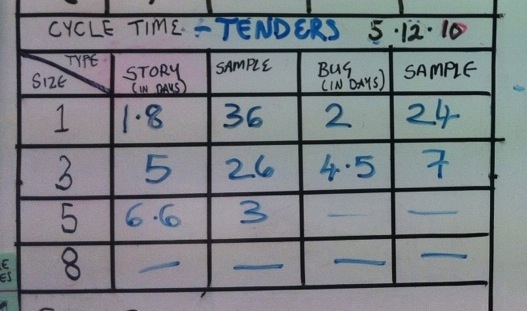
Cycle time is the time that elapsed from the beginning to the end of a process. In lean practice, this metric takes the place of velocity as a way of understanding how fast we’re moving.
This team are tracking cycle time from the moment a card comes into play until it is done. The grid shows the average time for a story to transit the board, by type and size of card, and the size of sample. So, for example, a 3 point story takes this team an average of 5 days to complete, with bugs taking slightly less: 4.5 days. This figure is an average over 26 cards.
Teams often use old-school office date stamps to stamp today’s date on a card when they pick it up to work on, and again when it’s done. Later on, someone can simply subtract one date from the other. Alternatively, if the team is working in iterations, team members can simply write the day number of the iteration on the card.
Here is a slightly more hi-fi version:

Spotted: Aconex Extensions Team