Cycle time is the time that elapsed from the beginning to the end of a process. In lean practice, this metric takes the place of velocity as a way of understanding how fast we’re moving.
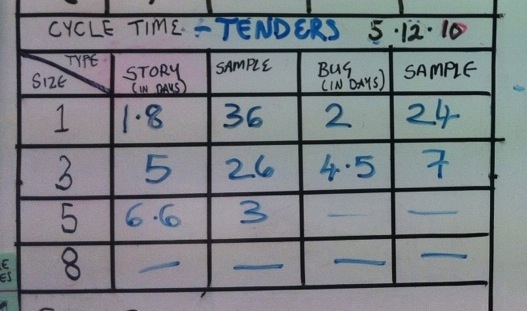
This team are tracking cycle time from the moment a card comes into play until it is done. The grid shows the average time for a story to transit the board, by type and size of card, and the size of sample. So, for example, a 3 point story takes this team an average of 5 days to complete, with bugs taking slightly less: 4.5 days. This figure is an average over 26 cards.
Teams often use old-school office date stamps to stamp today’s date on a card when they pick it up to work on, and again when it’s done. Later on, someone can simply subtract one date from the other. Alternatively, if the team is working in iterations, team members can simply write the day number of the iteration on the card.
Here is a slightly more hi-fi version:

Spotted: Aconex Extensions Team