Posts Tagged Lean
Revenue on a Card
Posted by nthorpe in If we tell you we'll have to kill you on July 3, 2011

Sometimes it feels like the agile community knows the cost of everything, and the value of nothing. We have clever ways to measure velocity and to estimate the size (and therefore cost) of pieces of work, and we like to obsess over these. But when do we ever quantify the value which will be delivered by a piece of work? Relative value is taken into account when a product owner prioritises higher value stories in the backlog, and some methodologies do take a shot at quantifying business value nowadays, but I don’t see much evidence of teams trying to quantify the value of a piece of work either before, or after it is delivered.
Deming says “Plan, Do, Check, Act“. But most of the time it just feels like “Plan, Do, Plan Do, Plan Do”.
I salute this team which puts the revenue at stake right on the card for everyone to see. If this is job is blocked for a day – is it a big deal, or not? Look at the revenue at stake. It’s a big deal.
Spotted: anonymous
Card Equaliser
Posted by nthorpe in Lonely Planet Mobile Dev Team, lonelyplanet.com on June 13, 2011

Team says: “A cool way to visualise the output of each iteration.”
What to do with cards after an iteration is finished?
Tear them up? Spike them? Leave them on the bus?
How about turning them into a ‘card equaliser’?
The idea behind this hack is to give a visual representation of the cards signed off in each sprint.
The card colours represent bugs, features, BAU support and tech stories. By arranging them on a spare wall according to colour groupings it’s easy to see how many cards and of what type have been signed off each sprint. For example, feature cards, defects, and tech cards. And you can see how this changes over time.
It’s also immediately apparent whether the main activity has been skewed towards one area. It takes it’s name from it’s similarity to the display of a graphic equaliser.
Like this:

Just by walking past, it’s easy to learn a lot about this team’s work:

So.. what this board is telling me is …
… this team pumped out a lot of features in a short time then faced down some serious technical debt and some outstanding defects.
Here’s another card equaliser, this time from the Lonely Planet web site team.

Spotted: lonelyplanet.com website and mobile development teams.
Here’s another variant, from a different source. Might be useful if you don’t have a lot of space:

A card spike
Posted by fe in lonelyplanet.com on June 12, 2011

Katie's unicorn spike.
Katie says: “There’s something really satisfying about spiking the completed cards at the end of each iteration”.
Here’s another take on what to do with the cards once the iteration is complete – stick them on a custom-made giant spike and top it off with a unicorn!
It’s important for a team to recognise the progress that they’ve made over a series of iterations. Watching the cards rise higher and higher up the spike is satisfying and a visual indicator of how much work the team has done.
Spotted: lonelyplanet.com website development team
Release Readiness Traffic Lights
Posted by nthorpe in lonelyplanet.com on June 11, 2011
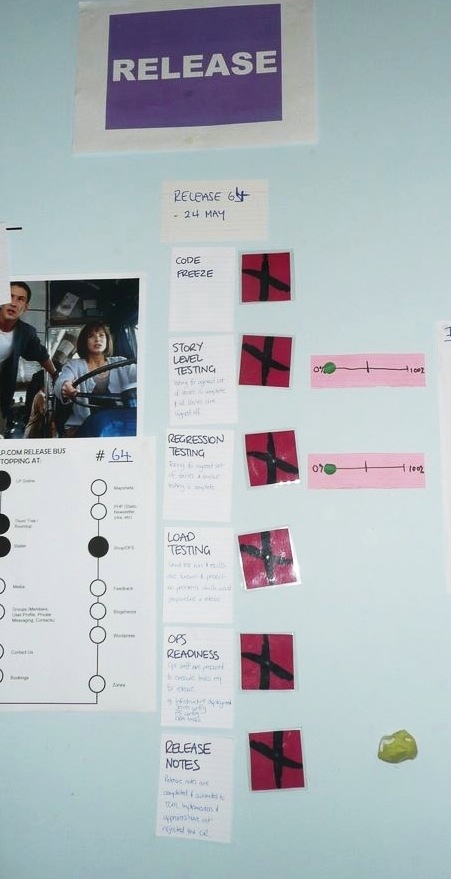
Nick says: “The first time we did this, it helped us to get our release success rate up. It was a long road, but this was one thing which helped.”
We were working on a sprawling web site made up of 22 separate applications which may or may not need to change for a particular release. The release would bring work by 2 to 4 teams to production. As we moved to biweekly releases, we needed a way to see exactly how our preparations for release were going. Is regression testing complete? Did we pass load testing?
So we decided on what our criteria were for a release to be good-to-go, and made each criterion a traffic light which could be red or green. This included a “stop the line” light which developers could turn to red at any time if they felt the release was too risky.
Each day, from three days out til release, we would stand around the release readiness traffic lights after morning standups were over and discuss the status of each light (“is that really green?”), and agree on actions to get to green.
Spotted: lonelyplanet.com website development team
Tracking Cycle Time, lo-fi
Posted by nthorpe in Aconex Extensions Team on June 4, 2011
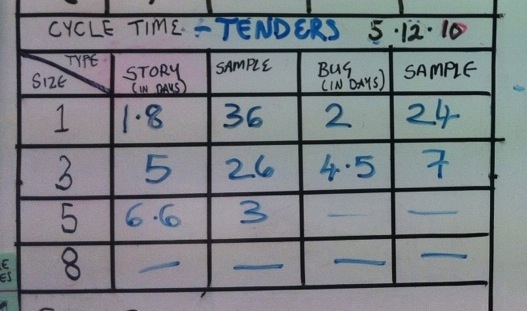
Cycle time is the time that elapsed from the beginning to the end of a process. In lean practice, this metric takes the place of velocity as a way of understanding how fast we’re moving.
This team are tracking cycle time from the moment a card comes into play until it is done. The grid shows the average time for a story to transit the board, by type and size of card, and the size of sample. So, for example, a 3 point story takes this team an average of 5 days to complete, with bugs taking slightly less: 4.5 days. This figure is an average over 26 cards.
Teams often use old-school office date stamps to stamp today’s date on a card when they pick it up to work on, and again when it’s done. Later on, someone can simply subtract one date from the other. Alternatively, if the team is working in iterations, team members can simply write the day number of the iteration on the card.
Here is a slightly more hi-fi version:

Spotted: Aconex Extensions Team
Get on the Release Bus – you know you want to
Posted by fe in Lonely Planet SPP Dev Team on June 4, 2011

The LPOS team's release bus starts to fill.
Team says: “That bus is getting full. Looks like it might be an Indian bus“.
Ok. You have achieved continuous delivery. You can now release your features whenever you like. But how do you know when it’s time for a release? You want to keep the value flowing out to your customers. How do you track which cards are going in the release?
One way is to use a release bus.
All the stories that will go out with the release are moved onto the bus as they are signed off. There are limited seats on the bus – when the seats are all full then it’s time for a release. There’s no reason to wait until all the seats are full though, a release should still happen whenever it’s required. On the other hand, a release bus that has run out of seats is a sure sign that there are getting to be too many stories in the release and that it might be a good idea to release in order to minimise complexity and risk.
Spotted: LPOS Team
Board Movies
Posted by nthorpe in Lonely Planet SPP Dev Team on May 28, 2011
Dan says: “Just for interest – I thought it would be interesting to see whether any notable patterns came out of it.” – Dan Heath
Sometimes at retro it’s hard to remember everything that went on during the iteration. And sometimes you don’t spot problems at the time they are actually happening. There’s just too much going on.
The brilliant Dan Heath set up a camera with a script which took a photo every 5 minutes and stitched them together as a movie. The team can watch the iteration at retro and can see the cards moving (or not moving) on the wall. Where did they become blocked? Anyone remember why? Who took the last bit of cake?
Dan’s script stitches the images together into a month by month archive of activity on the board, and it only captures images during working hours, so you don’t get hours of spooky darkness.
He was happy to share his scripts. Here are the crontab entries, other scripts are available by email (although Dan warns they were done as a really quick hack job – “the nastiest hack I’ve written since uni”):
# ************* Crontab ***************
# m h dom mon dow command
*/5 8-18 * * mon-fri export DISPLAY=:0 && /home/robh/boardcam/vlc-cmdline/run.sh
1 19 * * mon-fri /home/robh/boardcam/vlc-cmdline/run_daily.sh
Spotted: LPOS development team
If it’s a Release Bus, where does it stop?
Posted by fe in lonelyplanet.com on May 18, 2011

The LP website team's release bus map.
Team Says: “We were sick of the confusion about which apps to deploy each release. Our release manager knew the site backwards but as soon as he wasn’t around it all fell apart”.
The website is a large, complicated beast with many apps to be deployed behind the scenes to provide a single experience for the user. A few times we forgot to release an app with the result that we broke something on the site. Also we needed everyone on the team to be aware of which parts of the system were going to change with each release.
The fix? Since we already had a release bus, we made a bus route map. Every app which runs the site is listed there, and a sticker gets placed over each app that the ‘bus’ needs to stop at during the release. It’s a great visual that provides a checklist to use during the release, and also helps non-technical types understand how complex our website is.
Spotted: lonelyplanet.com website development team
The Dead Card Cemetery – where dead cards go to die
Posted by fe in LP Content Desk on May 10, 2011

The LP Content Desk's Dead Card Cemetery.
Fe says: “That card might get zombied back into the backlog”.
Some cards just never seem to move up the backlog. They are always deprioritised to make way for something else. After a while it becomes apparent that they are never going to get prioritised, that there will always be something more important. But it can be hard to remove a story from the backlog – someone usually still holds that story close to their heart. It’s a good way of managing team members attachment to particular stories. It almost never happens – but if needed, a card can be brought back into play from the cemetery. It’s also a useful visual to show how many things that we think are really important at the time, actually become so unimportant that they never get done.
Spotted: Lonely Planet Content Desk